
MLB Lineup Card Props: Late Scratches and DH Rotations
 Available in US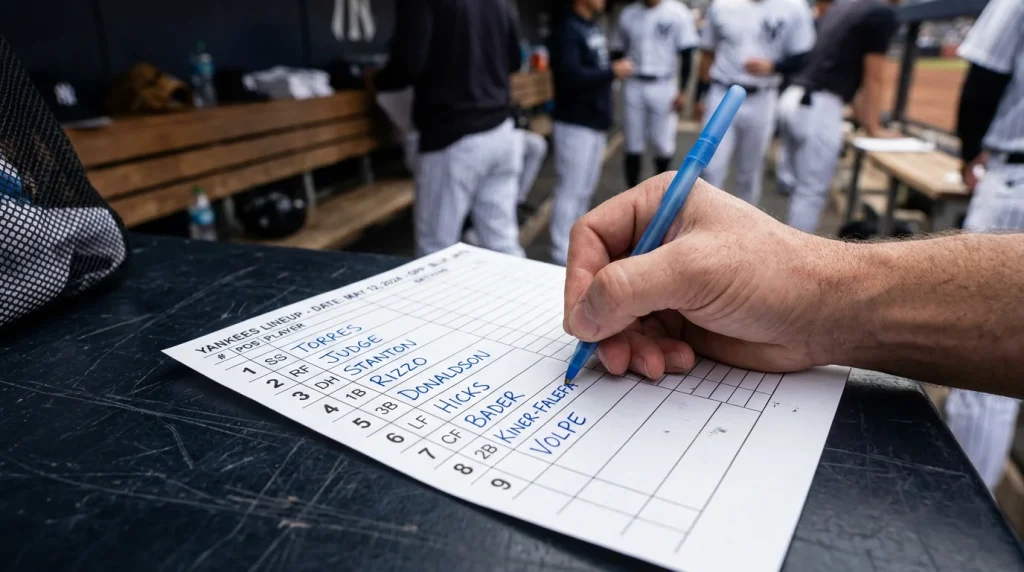
Adjusting Props Based on Late Lineup Card Scratches
I had a prop ticket built around a hitter slotted to bat third. The lineup card came out 90 minutes before first pitch. He was batting seventh. Not benched, not injured, just shuffled down the order because the manager wanted a left-right alternation against the opposing starter. The prop went from a strong play to a coin flip in the time it took the lineup feed to refresh. By the time I cancelled the ticket and rebuilt the play around a different hitter, the price on my new pick had already moved 8 cents in the odds because I was not the only punter watching the lineup card with a stake plan ready to fire.
The lineup card is the most underrated input in MLB prop betting because it changes the answer to almost every prop question on the slate. The same hitter at second in the order has a measurably different prop expectation from the same hitter at sixth. The same starter facing a left-heavy lineup has a different K profile from the same starter facing a right-heavy one. The 45-minute window between lineup release and first pitch is where the morning prep meets the actual conditions, and the punters who built their watchlist without checking the lineup card are working off stale data.
Plate Appearances and Why Order Matters
The structural reason batting order matters is that hitters higher in the order get more plate appearances per match. The leadoff hitter averages roughly 4.6 plate appearances per nine innings. The cleanup hitter averages roughly 4.2. The bottom-third hitters average closer to 3.7. That gap of 0.9 plate appearances per match is enormous when you compound it across the season – roughly 145 extra plate appearances for the leadoff hitter relative to the bottom-of-the-order regular. Every prop market built on counting events – hits, total bases, RBIs, runs – scales directly with that plate-appearance count.
The casual betting market processes batting order as a binary fact: starting lineup yes or no. That is the wrong granularity. The granularity that matters is the actual position in the order, because the same hitter at three in the order versus seven in the order is offering 0.7 fewer plate appearances. The hits over 1.5 line that prices fairly when he bats third becomes a meaningfully tighter line when he bats seventh, and the prop market does not always adjust by the right amount when the lineup card comes out.
On a season-long basis the hitter batting in the top three of the order will average around 670 to 720 plate appearances per 162 games, while the hitter batting seventh through ninth averages closer to 580 to 620. That is the structural sample-size difference that drives every counting-stat prop market. Knowing where in the order a hitter is slotted is not a refinement on the prop pick – it is the foundation of the prop pick.
The RBI Layer: Why the Hitters Around Him Matter as Much
RBI markets respond to lineup order even more sharply than hits markets, because RBIs are the joint product of the hitter making contact and the hitters in front of him reaching base. A cleanup hitter with elite contact quality but with the seven, eight, and nine spots in front of him producing low on-base percentages will have a lower RBI floor than a less talented cleanup hitter with two on-base machines hitting in front of him. The contact-quality input for the cleanup hitter is intrinsic to the bat. The opportunity input is entirely about lineup construction.
The prop market responds to the cleanup hitter’s name and to his recent form. It responds more slowly to the construction of the seven through nine spots in front of him, which is exactly where the value sits when the lineup card produces a non-default arrangement. A manager resting one of the on-base regulars and replacing them with a low-OBP backup will quietly cap the cleanup hitter’s RBI ceiling for that match, and the RBI prop price will not always reflect the change. Reading the lineup card means reading the construction, not just the names.
The detail of how the on-base hitters in front of a power bat shape the RBI market is in the RBI props piece; the lineup card is what tells you which of those on-base hitters is actually starting on any given match.
The Pitcher Side: Right-Left Splits and Lineup Construction
The lineup card matters for pitcher props as well as hitter props. A right-handed starter facing a lineup with seven left-handed batters has a structurally different K profile from the same starter facing a lineup with three lefties. The casual market knows this in the abstract – every book accounts for left-right splits in pitcher pricing – but the lineup card is where the actual handedness counts get locked in, and the morning watchlist built on the projected lineup may be off by one or two batters when the actual card comes out.
The other pitcher-side lineup variable is the bottom-of-the-order construction. A starter facing a lineup with three sub-.250 hitters in the seven through nine spots has higher K-prop expectation than the same starter facing a lineup that is deep across all nine spots. The bottom-of-the-order weakness is where the easy strikeouts come from, and it is where a starter goes from a 6-K projection to a 7-K projection without any change in his own form. Reading the bottom of the lineup card is a direct input into the K-prop overlay.
League-average strikeout rate sits in the low-to-mid 20s percent range for batters, with elite contact hitters down at 15 per cent and bottom-of-the-order regulars often at 28 per cent or higher. A starter facing four hitters at 28+ K% is in a structurally easier match than the same starter facing four hitters at 18 per cent or lower. That gap is where the K-prop overlay reads, and the lineup card is the direct input.
The Steal Profile: Speed in the Right Order
Stolen base props depend on a different lineup variable: the speed tier of the hitter and the on-base track record of the hitters in front of him in the order. A hitter who runs a 30-ft-per-second sprint speed batting second behind a leadoff hitter with a .380 OBP is in a structurally different SB context from the same speed hitter batting eighth with a low-OBP slot in front of him. League-average sprint speed sits around 27 ft/sec; elite is 28.5+ and the top tier is 30+. The speed alone tells you the floor of the SB market; the lineup-construction overlay tells you whether the floor will see opportunities.
The 2023 rule changes – bigger bases moving from 15 to 18 inches square, the two-step-off pickoff cap, the pitch clock – pushed the league-wide SB success rate from the high 70s into the mid-80s, which has structurally inflated the SB market. The relevant lineup question for the inflated market is not whether a hitter has SB ability, but whether the slot in the order produces the opportunities that turn ability into prop outcomes. The hitter batting eighth with the pitcher slot or a backup catcher behind him sees fewer first-base opportunities than the same hitter batting second behind a high-OBP leadoff slot.
The catcher on the other side is the other read. League-average pop time on a throw to second is 2.0 seconds, with elite catchers under 1.95 and below-average catchers above 2.05. The catcher’s pop time is on the lineup card too – when the opposing manager rests his starter and runs a backup defensive catcher, the SB market shifts directly. The same speed hitter against a backup catcher with a 2.10 pop time has a meaningfully better SB profile than the same hitter against a starting catcher at 1.93.
Reading the Bench: Pinch-Hit and Late-Inning Substitution Logic
The lineup card is not the full story of who hits. It is the projection of who hits in the first plate appearance. By the late innings, pinch-hit substitutions, double switches, and defensive replacements rewrite the lineup. For prop markets settled on full-game totals, the substitutions matter – a hitter who is pinch-hit for in the eighth has lost a plate appearance from his projected count, and the prop ticket built on his projected PA total now resolves on a smaller sample.
The substitution risk is not equal across all hitters. The cleanup hitter is rarely pinch-hit for. The seven-through-nine slots are where the substitution risk lives, especially in NL parks where the pitcher slot was historically subbed out routinely and where the universal designated hitter has not entirely eliminated late-game lineup churn. For prop tickets on bottom-of-the-order regulars, the substitution risk is real and reads directly off the bench depth on the lineup card.
The UK market is increasingly served by detailed lineup feeds and live updates, and the punter who is dialled into those feeds 90 minutes before first pitch is operating with the same information as the in-stadium reporter. The lineup card is the universal input, and the UK punter has it as fast as anyone in North America. The MLB Europe social channels – now serving more than 452,000 followers – push lineup graphics and bench-news updates faster than they were available even three years ago, which has materially reduced the information gap that once separated UK from US punting on this market.
The Ten Minutes That Pay the Most
The ten minutes after the lineup card drops are the highest-value period of the prop-betting day. The watchlist is built, the projections are in hand, the actual lineups are now public, and the prop market is reprocessing all of this in real time. The punter who has done the morning prep can act inside that window with confidence. The punter who is researching from scratch at lineup release is competing against the rest of the market on speed, which is a losing trade.
The discipline I have built across years of MLB betting is to be ready to act inside that ten-minute window. The morning is the prep. The lineup card drop is the trigger. The ten minutes after is the execution. Anything past 35 to 40 minutes before first pitch and the prices have usually moved enough that the structural value is gone. The lineup-card drop is the timing engine of the entire prop-betting day, and treating it as anything less than that is leaving the easier wins on the table.
BasePropPro Articles: MLB Prop Bets Strategies
MLB UK Start Times: Time-Zone Schedules for Punters
Optimizing Betting Schedules Around First Pitch Times The Dodgers play a Tuesday-night home game in Los Angeles. Pacific time on the scoreboard reads 19:10 first pitch. UK time on my…
MLB Strikeout Props: Analyzing Pitcher K-Rates for UK Punters
Exploiting Pitcher Strikeout Lines and Prop Markets Late one night a couple…
NRFI Props: No Run First Inning Pitcher Strategies
Evaluating Top-of-the-Order Risks for NRFI Bets About five years into modelling MLB…
+EV MLB Props: Devigging Prices and Calculating Expected Value
Calculating Realistic Edge Thresholds for MLB Props I spent two years thinking…
Published by the BasePropPro team.
