Total Bases Props: Why Slugging Beats Pure Hit Counts
Loading...
The Prop That Cured Me of Chasing Hit Counts
I used to back hit props more or less reflexively. Take a hot batter, take 1+ hit at any plausible price, log the result. Over a long sample I broke roughly even – which sounds like a result until you account for the time invested. The bet that quietly outperformed in my own ledger was total bases. Same hitters, same matchups, different framing. I switched the bulk of my batter exposure across to total bases two seasons ago and have not looked back.
Total bases is not a sexy market. It does not have the lottery feel of an HR prop or the binary clarity of a 1+ hit prop. What it has is precision. It pays you for the quality of contact, not just the count of contact, and that distinction is the entire point of this article. If you are a UK punter who has dabbled in MLB props and felt the basic batter markets were a coin-flip dressed up, this is the market that fixes that feeling. The MLB also signed a multi-year partnership with FanDuel as an Authorised Gaming Operator in 2023, which has accelerated total-bases prop coverage across the partner ecosystem and, indirectly, across UK books that mirror the data feeds.
How Total Bases Actually Count
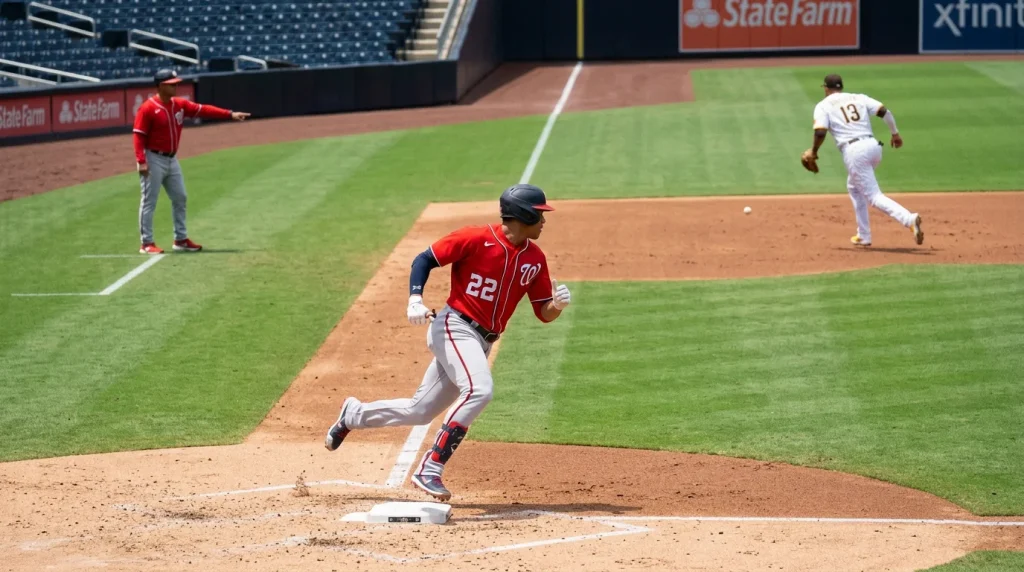
The mechanics matter. A single counts as one base. A double is two. A triple is three. A home run is four. Walks, hit-by-pitches, and reach-on-errors do not count toward total bases – only hits. Sacrifice flies do not count either, even if a runner scores. Stolen bases never count toward total bases despite the obvious vocabulary trap; total bases is strictly a hit-quality metric.
UK book settlement on total bases is uniform across the major operators, but the rules tab is still worth reading once. The specific edge case to know is what happens if the hitter is removed from the game mid-at-bat – say, an injury substitution or a pinch-hitter swap. Most UK books void the bet if the hitter has not had at least one official at-bat completed, and settle on the bases recorded if they have completed at least one. If you are staking on a hitter dealing with a niggle, that distinction can matter.
The other detail worth understanding is how a home run interacts with the line. A 1.5 line is cleared by any hit other than a single. A 2.5 line is cleared by a double-or-better, plus a single, or by a home run on its own. A 3.5 line essentially requires either a home run or three hits including extra-base contact. The line creates step changes, not a smooth curve, and that is exactly why slugging matters more than batting average for this market.
Why Slugging Beats Batting Average for This Market
Batting average tells you how often a hitter gets a hit. Slugging tells you how much damage that hit does. The total-bases prop pays for damage. So slugging – and its fancier cousins ISO and SLG-against-handedness splits – is the metric that matters.
Take two hitters in a vacuum. Hitter A is a contact slap-hitter batting .310 with a .380 slugging. Hitter B is a power hitter batting .240 with a .500 slugging. Hitter A clears a 1+ hit prop more often than Hitter B. But on a 1.5 total bases line, Hitter B is the better bet, because his hits are bigger. The slugging gap dominates the batting-average gap once you cross the 1.5 threshold. This is the structural reason hit-count props produce coin-flip results long-term while total-bases props reward power-quality reads.
The other implication: total bases punishes pure singles hitters in over markets. A leadoff hitter with a .310 batting average but a .390 slugging will hit the 1+ prop reliably and miss the 1.5 total bases prop almost as reliably. Books price this in, but UK casual punters frequently do not, and they end up backing the wrong market for the wrong hitter profile. The fix is to match the hitter’s power profile to the line – power hitters on 1.5 and 2.5, contact hitters never on total bases unless the price is genuinely soft.
Over 1.5 Total Bases: The Workhorse Line
The 1.5 total bases line is the most common offering at UK books and, in my view, the most useful entry point for the market. It is short enough to clear regularly – any extra-base hit, or a home run, or two singles in a single game settles it – but long enough to filter out the contact-only hitters whose volume is propping up the 1+ hit market.
The historical baselines I track suggest the over 1.5 hits at roughly 35 to 45 per cent for a league-average hitter, climbing into the 50 to 55 per cent zone for a top-quintile slugger. That is a meaningful spread, and it is the spread the bookmaker is pricing. A line at -130 implies roughly 56 per cent – which means you need a top-tier slugger in a favourable matchup to genuinely have an edge on the over. Anything weaker is a market trap.
What pushes a slugger into edge territory? The same overlay stack that drives the rest of batter prop research: handedness matchup, ballpark, pitcher hard-hit rate allowed, and weather. Some advanced datasets even surface backtests of the kind Dimers documented – a 9.6 per cent profit margin across 108 similar Outs Recorded plays is the sort of historical band that demonstrates the principle scales to bases-style markets too. The tighter your matchup filter, the closer your real-world edge gets to those backtested numbers. For more on the underlying-stat side I cover the hitter metrics specifically in the wOBA piece, which is where most of my baseline numbers come from.
Lineup Spot Impact: The Plate Appearance Multiplier
Total bases is a counting stat. The more times a hitter comes to the plate, the more chances they have to produce. That makes batting order one of the highest-leverage variables in the market. The leadoff hitter typically gets one extra plate appearance per game compared to a hitter in the seven or eight slot. Over a 1.5 line, that extra at-bat is the difference between a coin-flip and an edge.
Look at it this way. Suppose a hitter has a 55 per cent chance of an extra-base hit or two singles in any given plate appearance – actually a high estimate, but use it for the maths. Across four plate appearances, the probability of clearing 1.5 total bases is meaningfully higher than across three. That extra appearance is worth roughly 5 to 8 percentage points of clearance probability for most batter profiles. UK books price the headline batter-prop number assuming a typical plate-appearance count, but they do not always adjust enough for hitters batting at the very top or very bottom of the order, and that mispricing is consistent enough to be useful.
The corollary: bottom-of-order hitters are usually a fade on total bases unless the price is unusual. Three plate appearances against a strong starter is a brutally short window for damage. I rarely back anyone hitting eight or nine for total-bases overs regardless of the matchup. The Holy Cross sports economist Victor Matheson has noted that with so few MLB players hailing from the UK or the rest of the EU, the European market remains underdeveloped – which is its own strategic point about content, not pricing, but the corollary is that UK punters have to do the lineup-spot work themselves because UK-facing previews rarely surface it.
The Bet I Take Most Often in This Market
If you forced me to name a single play I take more often than any other in MLB props, it would be over 1.5 total bases on a top-of-order, opposite-handed slugger in a HR-friendly park, priced anywhere from -120 to +120. That setup combines all four key inputs: power profile, plate-appearance volume, platoon advantage, and ballpark. When all four align, the implied probability gap between the headline price and my own estimate is consistently 4 to 7 percentage points. That is the kind of edge you can quietly compound over a 162-game season without ever needing a huge hit.
The trap punters fall into is staking the same line on hitters who do not clear all four overlays. The numbers do not survive a partial setup. Discipline on the inputs is what separates a profitable total-bases ledger from a break-even one.
Prepared by the BasePropPro editorial staff.