Stolen Base Props in MLB: How New Rules Inflated the Market
Loading...
The Year Stolen Bases Stopped Being a Sideshow
Until 2023 I rarely staked stolen base props at all. The market was thin, the prices were ungenerous, and stolen bases themselves had been sliding in raw frequency for over a decade. Then MLB rewrote the rule book – bigger bases, pickoff limits, a pitch clock – and stolen bases jumped overnight. League-wide attempts spiked, success rates climbed, and a tired backwater of player-prop markets suddenly became one of the most interesting corners of the slate.
Three seasons in, the market has matured but the prices have not fully caught up to the structural reality. UK books still occasionally treat stolen base props with pre-2023 caution – short-priced unders on speed merchants, fat-priced overs on the same hitters – and the rule-change adjustment lag continues to throw up tactical opportunities for punters who have done the homework. Across an MLB regular season of 2,430 games, the volume of stolen-base prop opportunities is wide enough that even small persistent edges compound into real returns.
The 2023 Rule Changes That Reshaped Everything
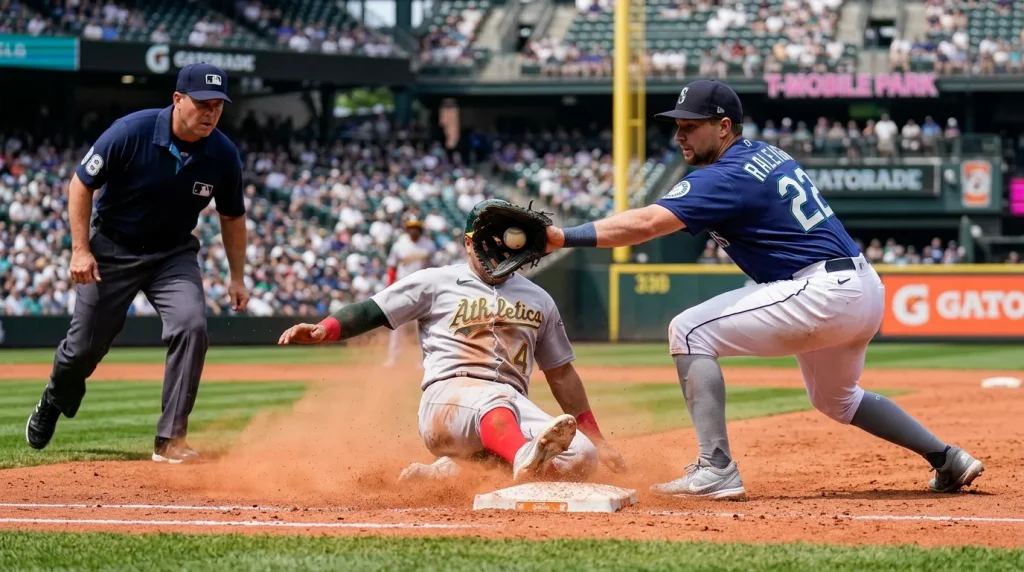
I want to walk through the rule changes because they are the foundation of every stolen-base prop decision you make today. First, the bases got bigger – from 15 inches square to 18 inches square. That sounds trivial. It is not. Bigger bases shrink the gap between bases by roughly 4.5 inches, which translates directly into faster steal times. A close play in 2022 was a thrown-out runner; the same play in 2026 is a successful steal.
Second, the pickoff rule. Pitchers are now limited to two pickoff attempts per plate appearance – sometimes called step-offs. A third unsuccessful attempt is a balk, awarding the runner the next base for free. That cap fundamentally changes the mental game. Pitchers cannot keep the runner pinned indefinitely, which means runners can take bigger leads with less risk. The pickoff cap alone has been the biggest structural lift to stolen-base success rates league-wide.
Third, the pitch clock. Pitchers have a strict time limit between pitches, which removes one of their main weapons against runners – varying their delivery time. With shorter, more uniform delivery times, runners can time their jumps with more confidence. The combination of all three changes raised the league-wide stolen-base success rate from the high 70s to the mid-80s in the first year, and that bump has persisted. The MLB also entered a multi-year partnership with FanDuel as an Authorised Gaming Operator in 2023, which is part of why the post-rule-change prop market expanded so quickly across the partner ecosystem and, indirectly, across UK books that mirror those data feeds.
Sprint Speed: The Single Most Useful Filter
If I had to recommend one number for stolen-base prop research, it would be sprint speed. Statcast measures it in feet per second on a hitter’s fastest one-second window during competitive runs. League average sits around 27 ft/sec. Anything above 28.5 is genuinely fast. Anyone above 30 is in the top tier of the league.
The reason sprint speed matters more than stolen-base totals is that it is a stable underlying skill, while stolen-base totals depend on opportunity. A speed merchant on a team that does not run will post low totals despite being elite at stealing when allowed. A medium-fast runner on an aggressive baserunning team will post higher totals despite being structurally less likely to succeed on any given attempt. Sprint speed strips away the team-context noise.
The ideal stolen-base prop target is a hitter with sprint speed in the top quintile, on a team with green-light baserunning instructions, batting at a lineup spot where they reach base regularly. The first variable filters who can steal, the second filters who is allowed, and the third filters who has the opportunity. All three need to align for an over bet to make sense. The rule changes have made even moderately fast runners viable, but they have not made anyone reading this an automatic bet.
Catcher Pop Time: The Variable on the Other Side
Sprint speed is half the equation. The other half is the catcher’s pop time – the time from the ball hitting the catcher’s mitt to the ball arriving at second base. League average is roughly 2.0 seconds. Anything under 1.95 is elite arm. Anything above 2.05 is below-average and gives runners a green light.
UK punters consistently overlook the catcher. They will research the runner’s speed thoroughly and ignore the man receiving the throws, which is half the matchup. A 28.5 ft/sec runner facing a 1.92-second pop-time catcher is in a difficult matchup; the same runner facing a 2.07-second catcher is in a steal-friendly one. The market knows this – pricing reflects catcher quality on average – but the lines often do not adjust enough for the extreme pairings, and that is where the edge sits.
Pop time data is publicly available and updated through the season as catchers go through hot and cold throwing stretches. A catcher recovering from a thumb injury, or one who has been working on a new release point, will deviate from their baseline meaningfully for weeks at a time. Tracking month-to-month pop times is the kind of work casual punters never do, and it is exactly where the persistent edge in the SB market lives. The MLB Europe social channels have grown to over 452,000 followers – more than triple their 2019 base – which has indirectly improved the data ecosystem available to UK punters because the league is investing more in publicly available stats and matchup tools to drive engagement.
Lineup Spot and Game Script: The Soft Variables That Decide Outcomes
A speed merchant batting ninth gets fewer plate appearances and reaches base less often than a speed merchant batting first or second. Plate appearances at the top of the order convert to baserunning opportunities at the top of the order, and that is where stolen-base props clear or fail.
The other situational variable is game script. Stolen bases are higher-leverage in close games and largely irrelevant in blowouts. A team trailing by six runs in the seventh will not send their runners; a team tied in the fifth, with their leadoff guy on first, will be aggressive. That means stolen base props are quietly correlated with the game total – close games produce more steal attempts, blowouts produce fewer. Backing a stolen base prop in a game with a high projected run total is structurally a worse bet than backing the same prop in a tight projected pitcher’s duel, even before you adjust for individual matchup.
One last detail: late-inning context. Many stolen bases happen in the seventh or eighth inning when teams are trying to manufacture a single run. If your hitter is in a position to reach base early but is likely to be lifted for a pinch-hitter or pinch-runner late, the stolen-base prop ceiling drops. Always check usage patterns before you stake. The article on the lineup card goes into late substitutions in much more depth.
Where the Market Still Misprices Speed
Three years after the rule changes, certain hitter profiles remain underpriced for stolen base overs. The clearest is the speed merchant on a previously slow-running team. Some clubs took longer than others to adjust their baserunning philosophy to the new rules, and the runners on those teams carry stale, low-volume profiles in the books’ models even when team philosophy shifts mid-season. A new manager or hitting coach can flip a team’s baserunning approach in weeks, and books are slow to catch up.
The other persistent mispricing sits with switch-hitters who run well from the left side but not from the right. Most book pricing treats sprint speed as a fixed input across handedness, but it varies – a hitter swinging left-handed has a marginal head start to first base because of the proximity advantage. That asymmetry occasionally shows up in stolen-base props as well, because a runner who reaches base from the left side has more time to settle into their lead before the next pitch, and that translates into a small but real lift in steal-attempt probability. None of these edges are huge. They are 1 to 3 percentage points at most. But across a season they compound, and they are the kind of detail the average punter never gets near.
Prepared by the BasePropPro editorial staff.